Want to boost reader engagement, social sharing and traffic? Try our publisher solutions.
Welcome to Shareaholic’s Browser Share Report. Last October, we noted Chrome’s ascent to become the industry’s clear market leader. Since then, we’ve continued to track the different browsers web users — 250+ million of ‘em — use when they visit our network of 300,000+ publishers.
If you’re a blogger, developer or site owner, you’ll want to pay close attention to our findings.
As someone responsible for a website, you should make it a point to know which the most popular browsers your audience uses are. Armed with that information, you can go ahead and build digital experiences that work seamlessly across those specified browsers. The following data reveals the world’s most popular browsers, including their respective market shares and how much those shares have grown or declined since our last published study.
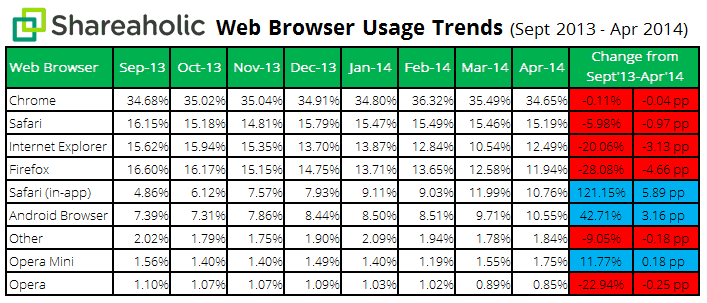
Here are the browser usage numbers for visitors to our network of sites over the last 8 months (click to enlarge):
The four most important findings are:
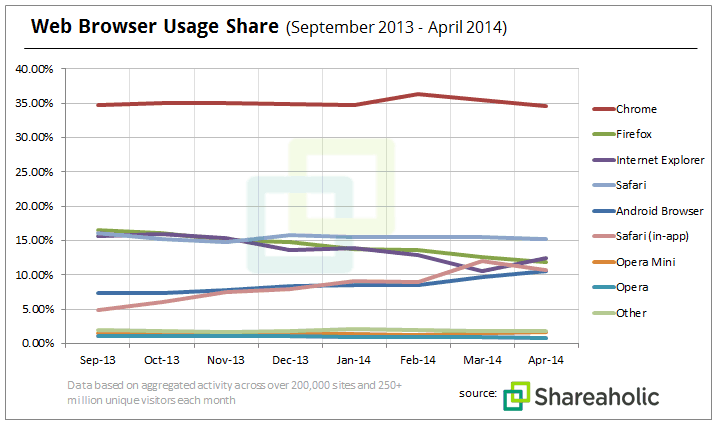
1) Chrome still dominates, but Safari is giving it a run for its money. Since September, Chrome’s share has remained fairly stable at ~35%, while Safari’s combined share (Safari plus Safari in-app) has jumped nearly five percentage points to ~26%, thanks to explosive growth in Safari in-app usage. Last month, Apple announced its Q2 2014 earnings report which revealed earnings that beat Wall Street analyst expectations due to still strong iPhone sales. It is no wonder why Safari is performing so well.
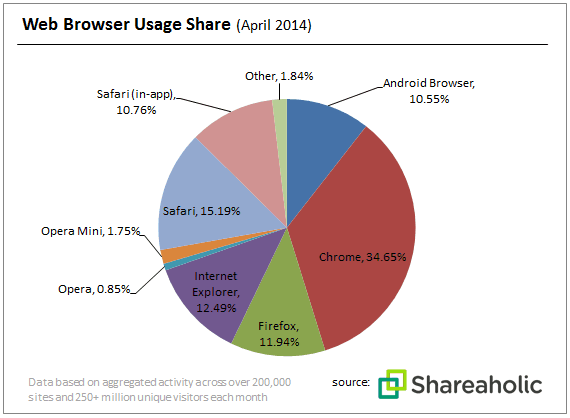
2) The Safari (in-app) browser and the stock Android browser were the only ones with meaningful growth. In the past 8 months, Safari in-app’s market share has grown a whopping 121.15% and claims 10.76% of the whole browser usage pie. Android grew a more modest 42.71% and now holds a 10.55% market share. At this rate, the stock Android browser will soon challenge Firefox and Internet Explorer for a coveted “top 4” spot on the list for most used browser. Growth in Safari in-app and Android browser usage confirms we are indeed an increasingly mobile society.
3) More than half of the browsers we tracked were in decline. Among the biggest losers were Internet Explorer and Firefox. IE usage shrunk 20.06% and now holds a 12.49% market share. Firefox took the largest hit shrinking 28.08% and now has an 11.94% market share.
4) Opera cannibalized its own market share. Though Opera’s mobile browser (Opera Mini) was among the three browsers whose usage shares grew during this study, that came at a cost to the market share once held by Opera’s desktop browser. Opera Mini’s share grew 0.18 percentage points while the market share for Opera’s desktop browser shrunk 0.25 percentage points, leading to a total loss of 0.07 percentage points in Opera’s overall market share.
We’ve shown you our numbers, now show us yours! Which browsers are most popular among your site’s visitors?
Exciting about building the next wave of digital marketing and publishing technology? We are hiring.


