With social media and mobile infiltrating communication more and more each day, online journalism is increasingly prevalent. Journalists are not only using Twitter and Facebook conversations to create stories, but they’re also relying on it for ways to share their content. It’s not just fans & followers: Social shares mean more traffic and better rankings.
This Poynter article looks at how journalists are tracking the impact of their Tweets by tracking click-throughs and ReTweets on tools like Bit.ly. Surprisingly, though, some of the journalists admitted that although they track these for their personal Tweets, no one is really doing that for their organization as a whole. As the article states: “Tracking social media organization-wide requires having an employee whose job it is to track this data — something that’s tough to accommodate for when you have limited resources.”
Some say there’s a “data explosion” at play: there’s no shortage of online data to digest. But what metrics can you act on, and what are the actions that will have the biggest impact? Here is where you can start:
Focus on your most engaged audience first.
Ask yourself – who are the 20% of readers that drive 80% of your traffic?
Your articles could be getting thousands, if not millions, of pageviews a day. You, not to mention your advertisers, may be interested to know what your most engaged and influential readers are like. Some things to consider:
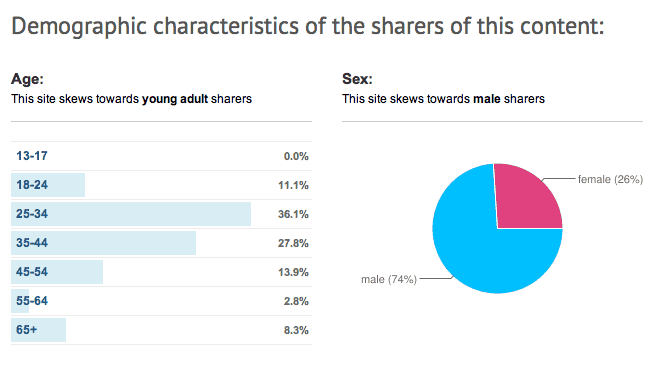
Demographics: What is the age and gender of your typical most engaged reader? Where are they located?
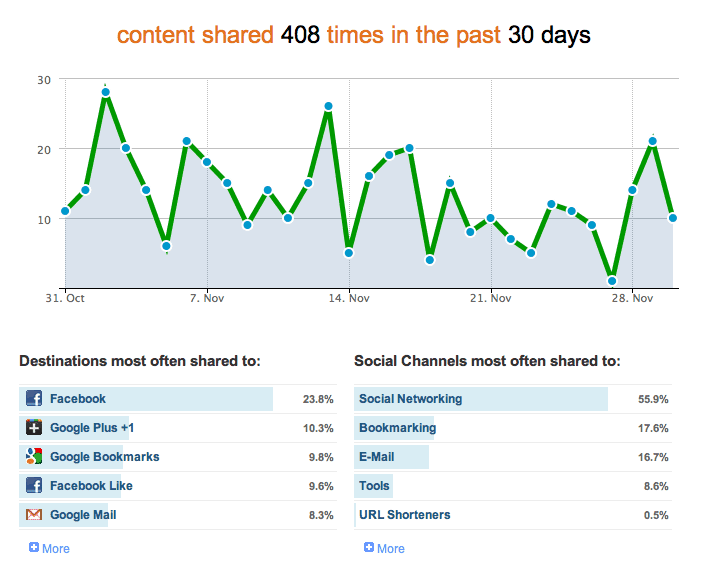
What networks or social channels does your content get shared to the most?
What content gets the most shares? What time of day does it get the most shares?
So what are the actionable takeaways from these? Tailor your editorial for this highly engaged audience by combining your interpretations for your overal audience metrics. Strategize what time of day you’ll publish certain types of content and the social networks where you’ll focus your engagement.
Shareaholic’s websites tools and a number of other tools can give you audience data like this.
What do you think? Do you track audience analytics? Let us know in the comments!
______________________________________________________________
Want audience data for your news? Try Shareaholic.

