Turn casual site visitors into raving fans. Get Shareaholic now.
The fact is, many of us spend an egregious amount of time using social media (sharing tweets, commenting on FB posts, etc.). We lose ourselves in our ever updating feeds. The more curious among us even try to quantify the hours and minutes spent on social networking each day. But I’ve often wondered: What is our behavior post-click, when we actually interact with a link one of our friends shared socially?
To answer that question, we looked at the average visit duration, pages per visit, and bounce rate for visitors referred to our network of sites from each of the top 8 social media platforms.
Welcome to the first edition of Shareaholic’s “Social Referrals That Matter” Report.
In this study, we looked at 6 months of data (Sept’13 – Feb’14) across our network of 200,000+ sites reaching more than 250 million unique monthly visitors to get a sense of which social network drives the most engaged visitors.

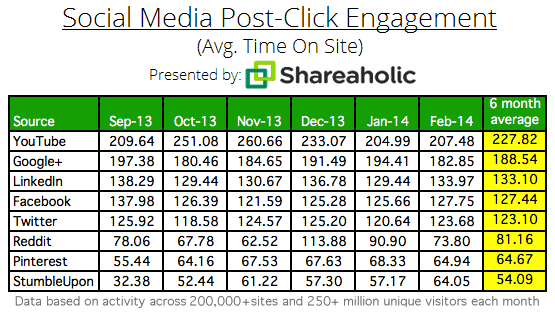
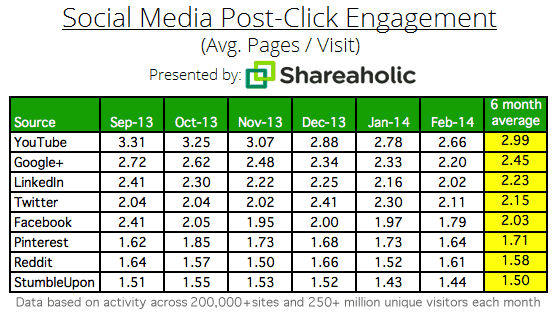
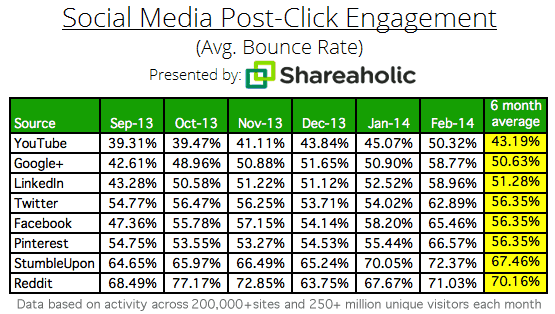
The above findings are represented as average values over the last 6 months for their respective categories: Time on Site, Pages / Visit and Bounce Rate.
Here are six noteworthy findings:
- YouTube is the undisputed champion. YT drives the most engaged traffic. These referrals have the lowest average bounce rate (43.19%), the highest pages per visit (2.99) and the longest visit duration (227.82 seconds). Why are visitors from YouTube so engaged? …because video itself is so engaging and viewers are likely to maintain a similar level of engagement with related content. Therefore, video watchers are especially receptive to links within video descriptions which complement the audio+visual content they just consumed. Another reason YouTube takes home the crown is because viewers are simply used to spending minutes — perhaps, hours — educating and entertaining themselves with awesome video and may have fewer qualms about taking extra time to discover more great content post-click.
- Although Google+ and LinkedIn drive the fewest social referrals, they bring in some of the best visitors. Google+ users, on average, find themselves spending north of 3 minutes diving into things shared by connections in their circles. They also visit 2.45 pages during each visit, and bounce only 50.63% of the time. LinkedIn users generally spend 2 minutes and 13 seconds on each link they click, viewing 2.23 pages with each visit and bouncing 51.28% of the time. Although many sites see minimal traffic from both Google+ and LinkedIn, now may be the time to invest in building communities within those networks if engagement really matters to your business.
- A referral from Twitter is as good as a referral from Facebook — at least, in terms of bounce rate, pages per visit and time on site. Tied in 4th place are Twitter and Facebook. Both types of visitors bounce the same (56.35% of the time), while Twitter wins the pages per visit category (2.15 vs 2.03) and Facebook users tend to spend more time on a site post-click than Twitter users do (127.44 seconds vs. 123.10).
- Pinterest isn’t exactly the social media golden child we all play it up to be. Coming in 6th, Pinners bounce as often as FB users and Tweeps do, but view fewer pages per visit (1.71) and spend considerably less time on site (64.67 seconds) than almost all of its counterparts, with the exception of StumbleUpon.
- Reddit users are the most fickle. Redditors are the most likely to abandon sites — on average, 70.16% bounce. For marketers, Reddit is a tough nut to crack. Its uber-loyal users are increasingly selective about the content that gets upvoted and are eager to downvote things they disagree with. Effectively, Reddit hates marketing. In the past, I’ve even encouraged site owners to quit Reddit. Naturally, I applaud (and envy) brands and businesses that do it right. An excellent example that comes to mind is Newegg’s involvement on /r/buildapc (h/t AGeezus).
- StumbleUpon drives the least engaged referrals. Post-click, users view a meager 1.5 pages per visit and spend 54.09 seconds on site. It would appear that StumbleUpon’s click-heavy — to “stumble,” “like” or “dislike” — focus makes users trigger happy to a fault. Users stumble onto the next thing rather than immerse themselves in the webpage SU recommends. Of course, not every recommendation SU serves will be spot on. Yet, in the instance that a user stumbles upon something that directly resonates with her/him, (s)he may even earn the title of “most engaged visitor of the day”.
For the full data set, here are three charts that show average visit duration (chart #1), pages per visit (chart #2), and bounce rate (chart #3) for each of the 8 social networks over the past 6 months.
How engaged are your visitors from your favorite social networks?

Want to help us build better content amplification tools? Join the team.